Time Averaged SAR Evaluation for Multi Transmitter Arrays
Dynamic time-averaged SAR evaluation balances multi-transmitter power budgets, cutting backoff penalties while securing compliance across global regulatory markets.


Mesh
Electromagnetic field distribution in multi-antenna wireless devices depends on the spatial separation and phase correlation of individual radiating elements. Modern handheld and portable equipment combines cellular Sub-6 GHz transceivers, mmWave beamforming arrays, Wi-Fi 7 MIMO radios, and Bluetooth modules within tightly constrained chassis volumes. When multiple antennas transmit concurrently, localized SAR distributions in human tissue interact.
Simply adding independent peak SAR values as scalar sums often produces overly conservative exposure estimates, forcing designers to apply unnecessary transmit power backoffs that degrade link margin and throughput. Evaluating multi-transmitter arrays requires assessing spatial overlap accurately across distinct frequency bands and antenna locations.
Phase-coherent combining occurs when antennas operate on identical frequencies with deterministic phase relationships, like multi-element 5G mmWave modules or Sub-6 GHz smart antenna arrays. Non-coherent combining applies to co-located radios transmitting on separate center frequencies or unsynchronized clocks, such as simultaneous 5G cellular and 5.8 GHz Wi-Fi signals. For non-coherent sources, total localized SAR is calculated by adding normalized SAR values point-by-point throughout the tissue volume.
Spatial separation between antenna main lobes determines whether peak exposure points reinforce each other or remain distinct, since localized fields decay with distance.

Spatial Peak Summation and Field Coupling
Interactions between nearby antenna elements alter localized energy distribution. When two active antennas operate in close reactive near-field proximity, mutual coupling shifts surface current distribution across both radiators, moving peak SAR locations away from their free-space baselines. Standard exposure evaluations measure individual SAR distributions per transmitter over a standardized three-dimensional voxel grid.
Spatial summation routines then build the combined SAR grid by summing E-field energy at every discrete voxel coordinate.
Volumetric E-field integration shows whether peak exposure points overlap within 1-gram or 10-gram cubic tissue masses. If spatial peak SAR locations for separate antennas are more than twenty millimeters apart, secondary exposure peaks rarely combine to exceed individual limits, as uncorrelated sources add scalar power. When antennas sit within five millimeters of one another, near-field coupling forces simultaneous volumetric measurement or conservative envelope summation.
Regulatory frameworks require exact spatial ratio calculations to demonstrate that multi-transmitter exposure ratios stay below unity.
| Transmitter Combination | Spatial Separation | Coupling Mechanism | Evaluation Requirement | Compliance Boundary |
|---|---|---|---|---|
| Sub-6 GHz Cellular + 5 GHz Wi-Fi | Greater than 20 mm | Non-coherent far field | Point-wise SAR ratio summation | Sum of SAR ratios under 1.0 |
| Sub-6 GHz Cellular + 2.4 GHz Bluetooth | Less than 10 mm | Surface current coupling | Volumetric grid integration | Combined 1g SAR under 1.6 W/kg |
| 5G mmWave Phased Array (28 GHz) | Internal array spacing | Phase-coherent array vectoring | Absorbed Power Density simulation | Combined APD under 10 W/m² |
| Wi-Fi 7 Dual Concurrent (5 GHz + 6 GHz) | 10 mm to 20 mm | Enclosure re-radiation | Multi-band spatial peak mapping | Sum of SAR ratios under 1.0 |

Multi Band Transmit Energy Budgeting
Radio architectures running concurrent cellular, Wi-Fi, and Bluetooth links partition total exposure limits across active channels. The total exposure ratio is the sum of individual transmitter SAR values divided by their respective regulatory limits, and normalized exposure must remain at or below 1.0 across all operational transmit conditions, governed by how antenna spacing dictates coupling behavior.
Dynamic power allocation management maintains a real-time ledger of active transmit channels. If a cellular modem boosts output power to maintain a weak base station connection, control software restricts maximum allowable transmit power on co-located Wi-Fi channels. Overall array design controls near-field interaction, and spatial peak separation allows higher simultaneous transmit power than co-located elements whose SAR hotspots directly overlap.
When antenna spatial peaks overlap completely, available RF output power for each radio drops by fifty percent during simultaneous operation, as phase alignment shifts field intensity. Effective multi-transmitter array design arranges antenna elements to distribute SAR hotspots across distinct physical locations on the product enclosure.
Placing antenna elements on opposite corners of a device chassis eliminates main-lobe SAR reinforcement, keeping total combined RF exposure within statutory limits without restricting individual channel output power.


Window
Regulatory energy limits for RF exposure traditionally assume static peak transmit power levels across active radios. This static assessment forces transceivers to limit peak radiated power based on worst-case continuous transmission scenarios. Time-Averaged SAR algorithms dynamically regulate transmit power over rolling temporal windows instead.
Because thermal injury to human tissue depends on cumulative absorbed RF energy rather than millisecond power spikes, dynamic time-averaging permits high peak transmit power during bursty data transmissions while maintaining compliance over standardized moving-average windows.
International regulatory frameworks specify exact time windows for exposure evaluation. Standards define a 100-second moving average window for frequencies below 3 GHz and a 60-second window for frequencies between 3 GHz and 6 GHz. Higher frequency mmWave allocations above 10 GHz use shorter windows down to 2 seconds or 4 seconds, reflecting shallower absorption in skin tissue.
Dynamic algorithms track instantaneous conducted output power to continuously compute the rolling thermal dose delivered to the user.
A 100-second moving average window allows a 3 dB power boost during burst transmissions provided the integrated energy over any 100-second interval remains below the single-transmitter compliance threshold.
Moving Average Duration and Energy Allocation
Time-domain sliding algorithms monitor instantaneous power to keep total radiated energy within legal boundaries. Modern cellular standards rely on high peak-to-average power ratios during packet data bursts. When dynamic SAR control is inactive, maximum burst power must remain at or below nominal continuous-wave limits.
Time-averaged power control allows transmit power to exceed static compliance limits during brief intervals, provided subsequent power drops proportionally to balance the running energy sum.
Because multi-radio devices share total energy, dynamic exposure budget management divides the available time-averaged absorption allowance between simultaneous radios. If cellular transmission requires maximum burst power for a voice frame or high-priority upload, the algorithm draws from the rolling window budget. Wi-Fi upload throughput decreases temporarily while the central control algorithm re-allocates remaining headroom to the primary cellular link.
Dynamic Power State State Machine Execution
Real-time firmware algorithms adjust individual transmitter grant levels using historical transmission logs. Baseband modems output real-time transmit power logs at sub-millisecond intervals, which the exposure control engine converts into instantaneous SAR values via factory-calibrated lookup tables. Algorithms integrate these instantaneous SAR readings across active time windows, calculating the remaining energy margin before hitting regulatory ceilings.
Firmware guard bands protect against temporal overshoot. If unexpected data traffic exhausts the exposure budget, the state machine triggers immediate transmitter backoff before rolling energy integrals breach legal limits, where moving time windows prevent thermal spikes. Dynamic power tracking algorithms operate across discrete time steps, continuously updating normalized exposure sums across all co-located antennas.
- Instantaneous power overshoot occurs when transmission bursts exceed dynamic target levels before baseband power control loops adjust output drive.
- Unsynchronized timing buffers generate calculation drift between modem power telemetry logs and central exposure tracking software modules.
- Incorrect state transition latencies delay power backoff execution when switching between isolated and simultaneous transmit modes.
- Improper multi-radio margin headroom exhausts total exposure allowance prematurely, causing abrupt link disconnections on secondary radio links.
Software limits enforce maximum exposure by having test firmware lock target levels during compliance evaluations. Technical attestation filings under IEC/IEEE 62209-1528 Clause 6.5 require continuous dynamic power logging across all operational state transitions to prove compliance throughout sliding evaluation windows.

Probe
Automated phantom measurement systems determine spatial SAR compliance by scanning physical sensor nodes through liquid tissue media. Continuous-wave testing methods fail when evaluating time-averaged multi-transmitter array radios. Measuring dynamic exposure algorithms requires high-speed acquisition platforms capable of capturing rapid power shifts across multiple frequency bands simultaneously.
Legacy single-probe mechanical gantries require hours to complete full three-dimensional volumetric scans, making real-time dynamic time-averaging evaluations unfeasible with moving probe assemblies.
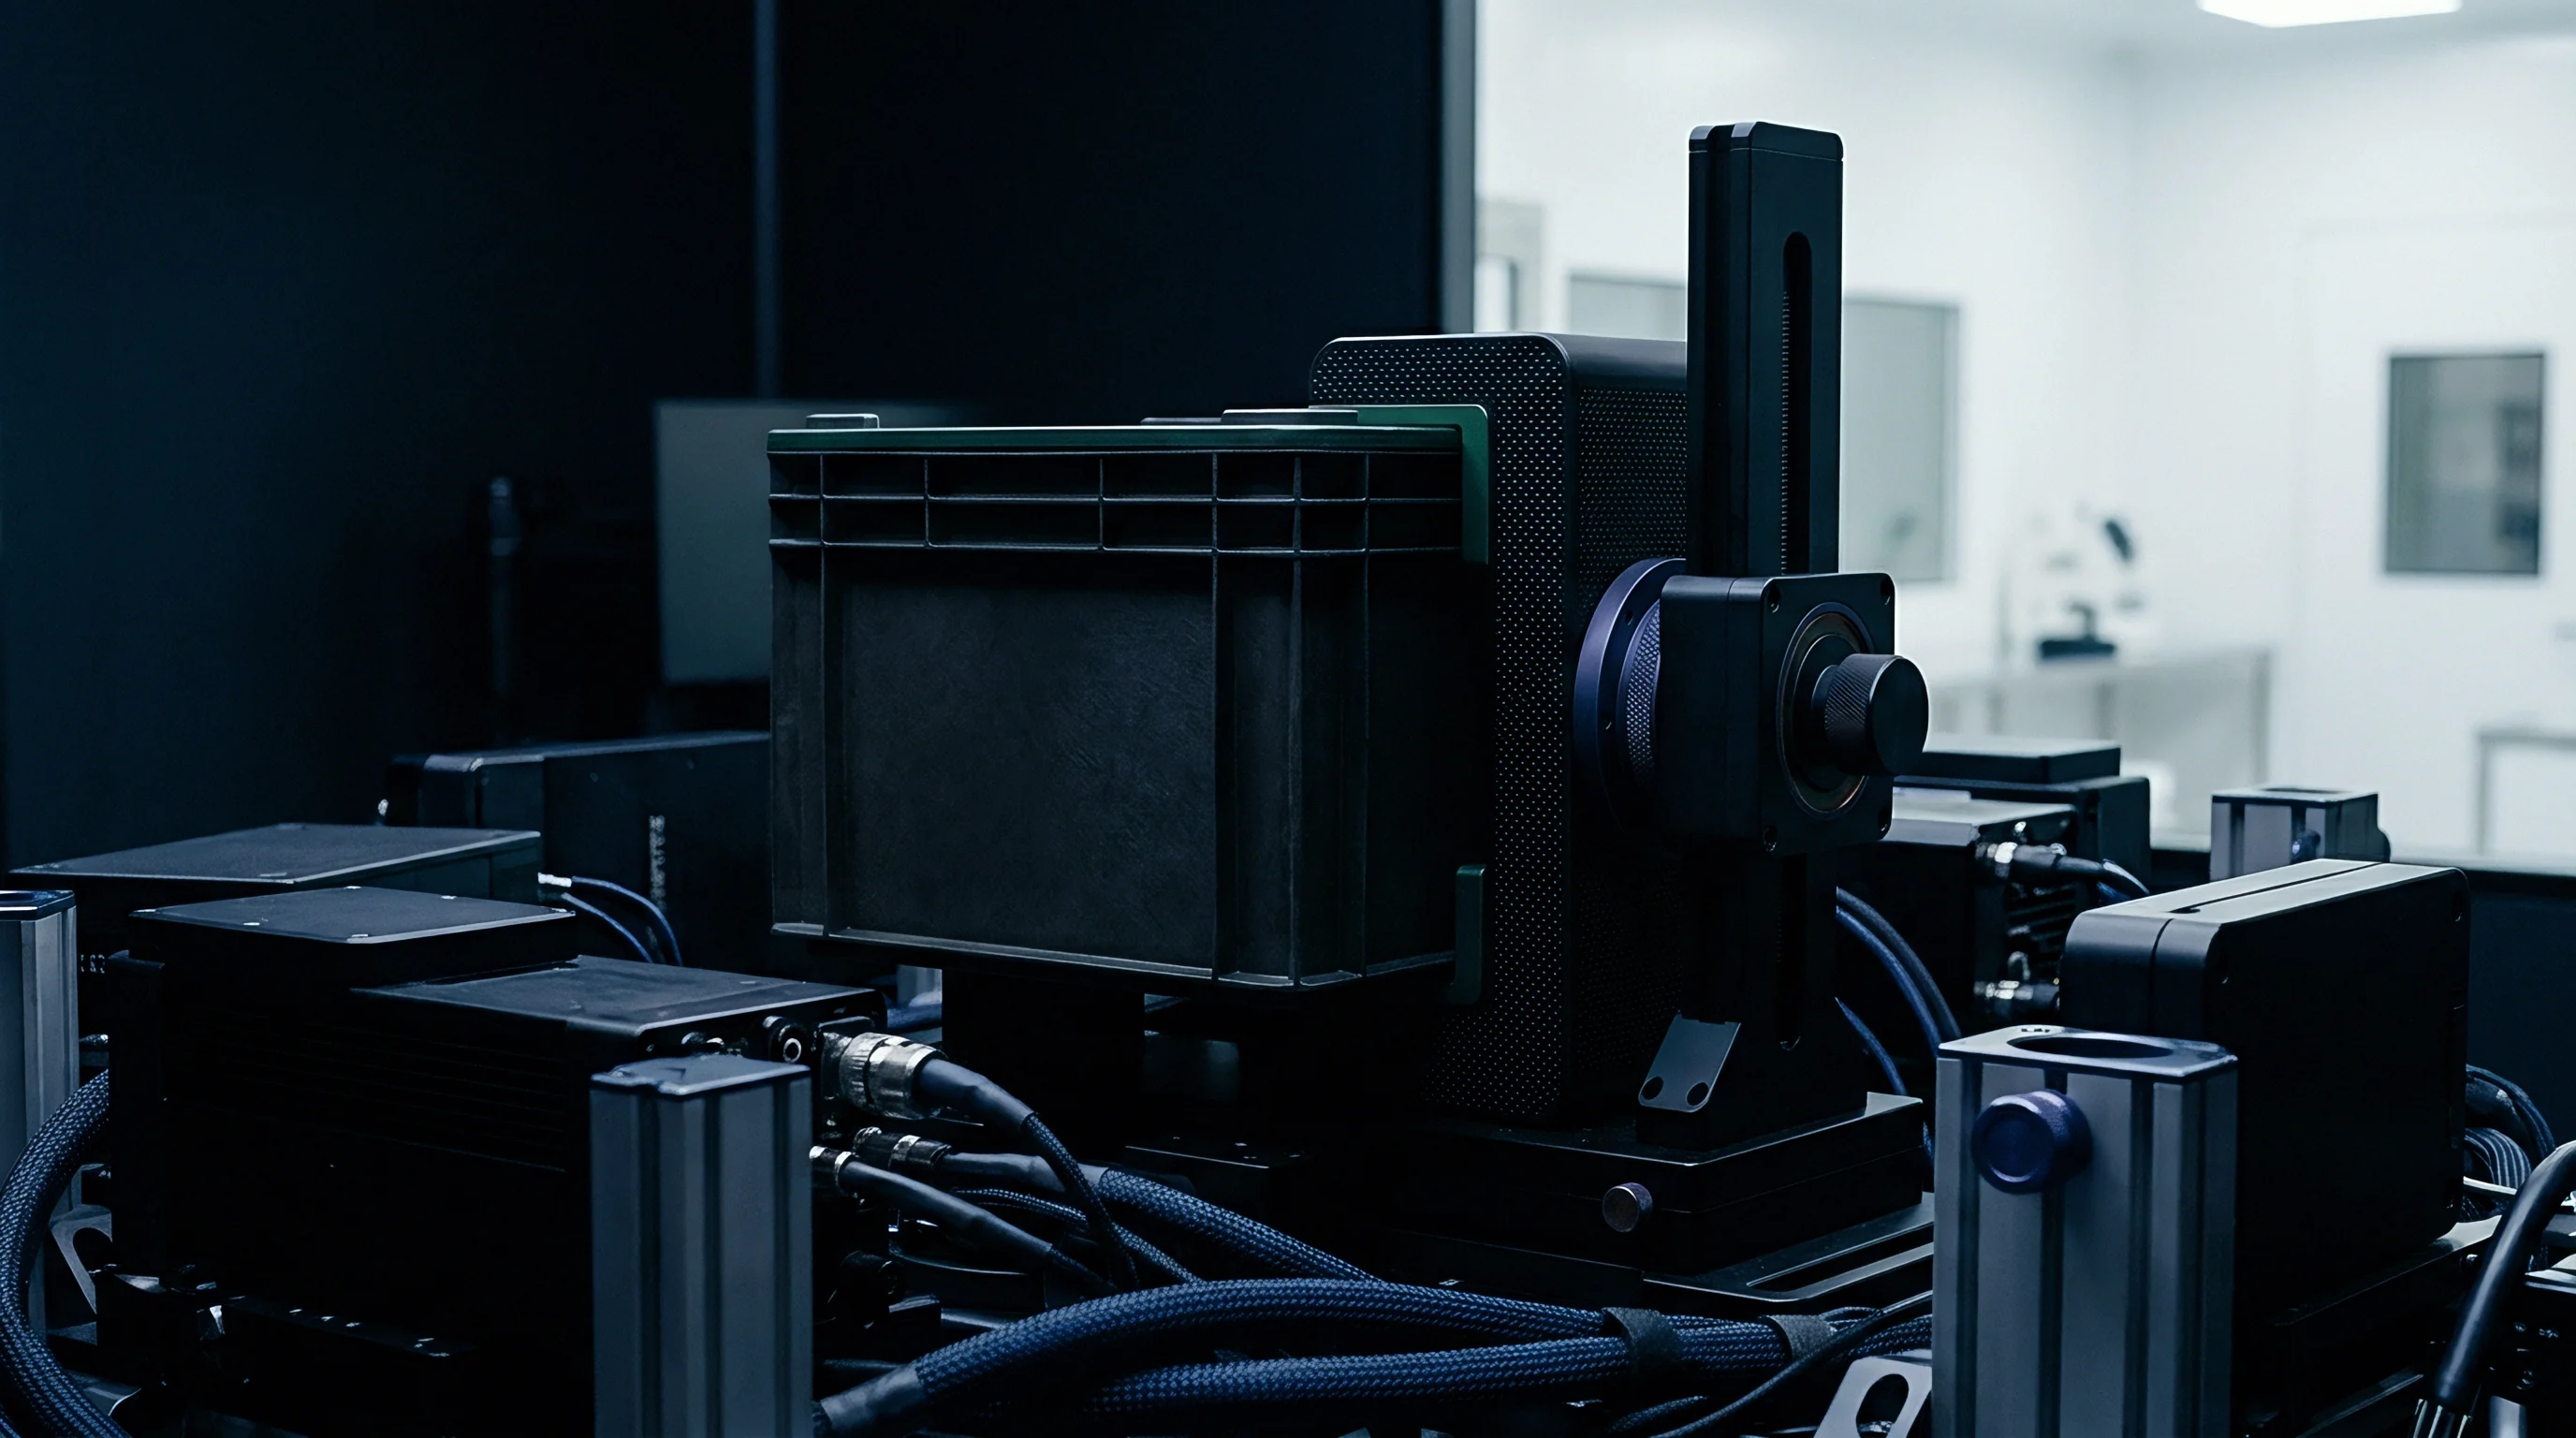
Modern SAR test facilities utilize vector near-field probe arrays and multi-probe scanning matrices. Multi-probe systems feature fixed arrays of miniaturized E-field sensors embedded beneath flat or head-shaped liquid phantom enclosures. These arrays reconstruct full volumetric SAR maps in sub-second timeframes without moving mechanical gantries during data collection.
Fast sampling rates enable continuous tracking of spatial E-field distributions while transceivers execute dynamic power control state transitions.
How Do Fast Probe Arrays Measure Transient Power Shifts?
Sensor arrays positioned inside liquid phantom enclosures record spatial E-field magnitudes at sub-second intervals. Array channels multiplex signals into high-speed digitizers, logging spatial E-field patterns alongside internal transmit power telemetry from baseband modems. Test automation platforms synchronize RF power meters at antenna ports with E-field sensor readings, matching physical radiation levels to internal firmware logs.
Liquid dielectric properties drift over time, so daily validation checks verify phantom liquid permittivity and conductivity parameters before launching multi-transmitter evaluation sequences. Fast probe arrays capture local field variations caused by active antenna switching and power backoff routines. Measuring transient dynamic SAR requires continuous sampling to prove maximum exposure never exceeds regulatory limits during worst-case power transitions.
Compliance reports filed under IEC/IEEE 62209-1528 Clause 7.2 require continuous time-series logging at sampling intervals under 100 milliseconds during transient power transition tests.
- Establish baseline continuous-wave transmit power levels for all co-located antenna ports on accredited test fixtures.
- Load automated power-time trace sequences into baseband firmware to simulate dynamic cellular and Wi-Fi traffic handoffs.
- Synchronize vector array probe acquisition clocks with baseband transmit power timing logs to capture transient power steps.
- Integrate measured E-field values across sliding 100-second and 60-second time frames to verify SAR compliance.
Automated Vector near Field Scanning Methodologies
Rapid measurement systems reconstruct full volumetric SAR profiles using phase and magnitude vectors. Vector near-field scanners calculate three-dimensional E-field distributions from two-dimensional planar measurements, reducing the number of physical sampling points needed. Probe arrays can capture field distributions across complex device housing surfaces in seconds.
Validating dynamic multi-transmitter algorithms requires evaluating multiple operational states. Laboratories execute power state transition test plans covering single-radio transmissions, multi-radio handoffs, time-averaging window resets, and maximum power call drops. Probe arrays measure localized SAR during each transition, producing complete spatial-temporal exposure maps for technical compliance dossiers.
| Measurement Architecture | Scan Time Per State | Isotropic Uncertainty | Transient Capture Capability | Relative Lab Hour Cost |
|---|---|---|---|---|
| Single E-Field Scanning Probe | 15 to 30 minutes | ± 0.2 dB | Incapable of capturing fast transients | Baseline standard rate |
| Planar E-Field Sensor Array | 1 to 5 seconds | ± 0.5 dB | Captures power steps over 100 ms | 1.8 times baseline rate |
| 3D Vector Near-Field Array Matrix | Under 1 second | ± 0.4 dB | Captures sub-10 ms power transitions | 2.5 times baseline rate |
Static multi-transmitter SAR evaluations do not always capture dynamic operation, as unrecorded transient power spikes frequently occur during dynamic state transitions.


Simulation
Numerical electrodynamic modeling calculates volumetric absorbed energy inside anatomically accurate human tissue models. High-frequency 5G mmWave modules and dense sub-6 GHz MIMO arrays present complex near-field spatial patterns that are difficult to measure exhaustively in physical test chambers. Finite-Difference Time-Domain solvers model complete device geometries, accounting for metallic housings, printed circuit board traces, battery enclosures, and dielectric covers.
Electrodynamic simulations evaluate phase-coherent beamforming arrays across hundreds of discrete beam codebooks. Scanning every phase codebook in a physical chamber requires excessive test time. Numerical simulation identifies worst-case spatial SAR codebooks, restricting physical chamber testing to critical high-exposure states.
Regulatory authorities accept numerical simulation results for multi-transmitter arrays when verified against physical probe measurements.

Finite Difference Time Domain Model Validation
Discrete grid modeling divides physical device enclosures and human tissue geometry into spatial voxels. Grid resolution must measure small fractions of a wavelength within high-dielectric human tissue media. Sub-millimeter voxel dimensions are required near antenna elements to capture steep spatial field gradients accurately.
FDTD algorithms calculate vector electric and magnetic field components across discrete spatial grids over temporal time steps.
Verifying numerical models requires physical measurement comparisons on identical reference devices. Regulatory guidelines specify that simulated peak 1g SAR values must match physical chamber probe scans within a fifteen percent uncertainty threshold. Validated simulation platforms generate spatial peak SAR maps and absorbed power density profiles across arbitrary device placements against human tissue surfaces.
Numerical field models validate SAR distribution shapes across complex device geometries, but physical chamber measurements establish the absolute reference level for regulatory submission.

Phase Coherence and Spatial Gradient Boundaries
Phase relationships between array elements shift localized absorption peaks across three-dimensional coordinates. In phased-array mmWave modules, active phase shifters steer main lobes to maximize the base station link budget. Steering antenna beams alters near-field phase distributions, moving peak skin energy absorption across the array aperture.
Simulations map spatial power density distributions across all factory-supported phase codebook states.
Absorbed power density calculations above 10 GHz evaluate total energy crossing tissue boundary surfaces. Numerical modeling integrates Poynting vector magnitudes over specified evaluation areas, typically 1 cm² or 4 cm² planar grids. Simulating simultaneous sub-6 GHz SAR and mmWave power density yields the overall exposure ratio distribution across multi-band radio devices.
The core computational challenge remains whether spatial grid resolutions can be unified across sub-3 GHz frequencies and 39 GHz mmWave bands without causing memory overflow during multi-transmitter array simulations.


Grant
Equipment authorization certificates for radios implementing dynamic power algorithms carry strict regulatory boundary conditions. Grant conditions specify approved host parameters, antenna gain boundaries, dynamic power software builds, and simultaneous transmission configurations. Operating a multi-transmitter array under an existing modular grant requires matching integration parameters to original filing conditions.
Deviations in antenna spacing, enclosure materials, or software backoff tables void existing regulatory approvals.
Federal agencies maintain specific administrative procedures for devices using dynamic RF exposure algorithms. The Federal Communications Commission requires a Pre-Approval Guidance inquiry before issuing equipment grants for radios utilizing time-averaged SAR control software. Regulatory bodies evaluate algorithm descriptions, power state verification logs, and dynamic chamber validation reports prior to granting authorization.

Pre Approval Guidance and PAG Filing Mechanics
Certification bodies submit specialized test plans to regulatory agencies prior to granting final market authorization. Filings must document algorithm mechanics, power measurement uncertainty budgets, transition state response times, and multi-radio energy tracking rules. Test reports include continuous time-series plots proving time-averaged SAR remains below legal limits during power level state transitions.
Permissive change procedures apply when altering approved host configurations. Class II Permissive Changes cover modified antenna placements, housing geometry changes, or updated dynamic power control tables. Changing internal software algorithms to modify exposure averaging time constants requires a new Equipment Authorization filing rather than a basic permissive change update, and technical dossier filings require raw logs.
| Regulatory Jurisdiction | Special Inquiry Requirement | Average Lab Test Time | Agency Review Duration | Filing Fee Range (USD) |
|---|---|---|---|---|
| United States (FCC) | Mandatory PAG / KDB 388624 | 3 to 5 weeks | 4 to 8 weeks | $8,000 to $15,000 |
| Canada (ISED) | Mandatory SPR-004 review | 3 to 4 weeks | 3 to 6 weeks | $5,000 to $10,000 |
| European Union (CE RED) | Notified Body opinion required | 2 to 4 weeks | 2 to 4 weeks | $4,000 to $8,000 |
| Japan (Giteki / MIC) | Technical Regulations Conformity | 2 to 4 weeks | 2 to 5 weeks | $6,000 to $12,000 |

Software Lock and Host Integration Requirements
Hardware manufacturers embed cryptographic verification into baseband software to prevent unauthorized user alteration of transmit power tables. System integrators must lock dynamic power lookup parameters inside secure flash memory partitions. If end users alter baseband software to bypass dynamic power backoff routines, device approvals become null and void.
Host documentation must explicitly outline active multi-transmitter operational modes. User manuals specify required minimum separation distances between radiating elements and human body surfaces during operation. System developers must verify that host software drivers accurately communicate active transmit states to the central power management engine under all operating system load conditions.
- Algorithm architectural specification defines time-averaging math, state transition logic, and baseband power sampling intervals.
- Real-time power tracking logs record synchronized conducted output power telemetry during automated chamber test runs.
- Numerical simulation validation dossier compares calculated spatial peak SAR maps against measured physical probe data sets.
- Host firmware security attestation details code-signing mechanisms preventing user modification of dynamic power calibration tables.
Integrating an approved radio module into a custom host enclosure without re-evaluating multi-transmitter dynamic exposure leads to immediate product hold orders by market surveillance authorities.
Schedule
Launch timelines for modern multi-radio consumer hardware depend on the critical path of regulatory test campaigns. Dynamic time-averaged SAR evaluations add complexity compared to legacy static compliance testing. Laboratory scheduling requires early preparation, accredited test fixture availability, and validated dynamic test automation scripts.
Prototype hardware delays directly compress available test chamber slots, creating launch delays if RF exposure non-compliance emerges late in product development cycles.
Sourcing teams must budget for accredited chamber hours, agency application fees, and engineering retest buffers. Test plans involving multi-transmitter power averaging require dedicated engineering support from baseband chipset vendors to configure dynamic control software during chamber runs. Booking specialized vector array chambers weeks in advance protects project milestone deadlines.
A failed dynamic SAR validation run consumes both the lab booking fee and the product launch date.
Chamber Booking Logistics and Test Campaign Execution
Test lab availability dictates early prototype validation timelines and market launch readiness. Accredited testing facilities operating fast vector probe arrays maintain long waiting lists during peak consumer device development seasons. Securing chamber capacity requires providing detailed RF system specs, active band combinations, and dynamic algorithm attestation documentation weeks before shipping sample units.
Physical sample counts must account for destructive pre-scans, liquid phantom compatibility testing, and backup hardware needs. Sample radios require dedicated RF conductive test leads soldered directly to individual antenna feed lines to log real-time power outputs alongside radiated chamber measurements. Incomplete sample preparation delays testing campaigns, losing reserved chamber slots and pushing regulatory submission dates back.

Financial Impact of Unplanned Retest Cycles
Certification failure on dynamic SAR algorithms triggers immediate chamber rescheduling and firmware engineering costs. Modifying dynamic power backoff parameters to resolve spatial peak SAR failures alters baseband software build signatures, invalidating prior test steps and adding a four-week delay to re-testing.
Engineering teams must re-run baseline conducted power calibrations, dynamic state transition logs, and multi-transmitter spatial overlap scans following any firmware backoff adjustments. Unplanned chamber re-scans incur extra daily testing fees, inflating compliance budgets beyond original projections. Staged regulatory filings prioritize primary target markets to generate early revenue while secondary geographical approvals undergo longer Pre-Approval Guidance review cycles.