Simultaneous Transmit SAR Evaluation Thresholds in Portable Radio Systems
Simultaneous SAR evaluations require summing standalone SAR or estimated values to prove combined exposure remains below regulatory limits.

Proximity

Operational Boundary and Standalone Exclusion Thresholds
When a human body touches a handheld enclosure, radio frequency energy absorption depends on transmitter output power and physical separation. Portable devices operated within 20 cm of human tissue require physical SAR testing or calculation to verify safety compliance. For single-transmitter devices, regulatory frameworks establish threshold power levels below which full SAR measurement is not required.
These standalone exclusion thresholds depend on operating frequency and the minimum distance between the antenna and tissue.
For North American regulatory filings under FCC rules, standalone test exclusion relies on a power-to-distance formula. At a test separation distance of 5 mm or less, an adjusted output power below 10 mW at 2.4 GHz generally permits SAR test exclusion. As separation increases to 10 mm or 15 mm, allowable transmit power increases proportionally.
Designers use these numerical boundaries to guide antenna placement and set maximum conducted power limits before submitting hardware for laboratory verification.
ISED regulations in Canada and RED harmonized standards in Europe use similar frequency-dependent threshold tables. Operating at 2450 MHz with a 5 mm separation distance yields a standalone exclusion ceiling of approximately 4 mW under Canadian RSS-102 rules ~ significantly stricter than the corresponding FCC boundary. A radio module exempt from SAR testing in the United States may require full physical probe testing for Canada.
Sourcing teams evaluate target markets early in module selection to avoid unexpected certification costs.
Power Levels and Frequency Scaling Mechanics
Radiated energy attenuates faster in biological tissue as operating frequencies move higher into the microwave band. Sub-GHz electromagnetic fields penetrate deeper into simulated muscle tissue, whereas signals at 5 GHz deposit energy in a shallower, more concentrated surface layer. Regulatory formulas account for this behavior by scaling exclusion thresholds inversely with the square root of the operating frequency in gigahertz.
Handheld wireless devices operating within five millimeters of human tissue encounter vastly different standalone test exemption limits across global regulatory regimes.
Determining maximum output power for SAR exclusion requires using the manufacturer’s maximum rated tune-up tolerance rather than average bench measurements. If a Bluetooth module delivers a nominal conducted power of 4 dBm with a tune-up tolerance of plus or minus 1.5 dB, the SAR calculation must use 5.5 dBm (3.55 mW). Using nominal power instead of maximum upper-tolerance power invalidates regulatory filings during laboratory audits.
Designing antenna separation to exceed near-field reactive distances remains the most reliable way to avoid unexpected multi-transmitter testing delays.


Ratio

Summation Formulas for Concurrent Radiators
Combining multiple active transmitters in a single handheld chassis requires accounting for concurrent exposure. When a portable device operates cellular, Wi-Fi, and Bluetooth radios simultaneously, total human energy absorption is evaluated as a cumulative sum. Regulatory agencies do not allow transmitters to be evaluated in isolation when their transmission windows overlap.
Simultaneous compliance is typically evaluated using the Sum of Specific Absorption Rates. When the combined SAR value of all co-located transmitters stays below the regional limit, the device complies without requiring spatial analysis. In 1-gram SAR regimes with a 1.6 W/kg limit, the sum of individual SAR values must fall below that limit.
If an individual low-power transmitter qualifies for standalone SAR test exclusion, it receives an estimated SAR value for summation. For 1-gram applications, estimated SAR is calculated by multiplying conducted transmit power by the square root of frequency in gigahertz, then dividing by the product of separation distance and a fixed scaling constant. This prevents unmeasured secondary radios, like low-power Bluetooth beacons, from being omitted from cumulative exposure calculations when operating alongside cellular transmitters.

Where Does Simultaneous SAR Trigger Full Evaluation?
Multi-transmitter physical scanning becomes mandatory when cumulative SAR calculations exceed regional safety ceilings. If the sum of standalone and estimated SAR values exceeds 1.6 W/kg for 1-gram limits or 2.0 W/kg for 10-gram limits, test exclusion no longer applies. Hardware developers must then either adjust physical antenna separation or perform volumetric SAR scans using robotic probe stations.
Volumetric SAR testing measures spatial distribution of radio frequency fields inside phantom models. When antennas are spaced well apart within an enclosure, their peak energy absorption zones do not overlap spatially. Calculating the Peak Location Separation Ratio allows systems that exceed direct additive limits to pass evaluation without requiring hardware redesign.
When the distance between the primary spatial peaks of transmitter A and transmitter B is sufficiently large, combined local exposure remains well below peak levels. The ratio of the summed SAR raised to the 1.5 power divided by the spatial distance between peaks serves as the decision threshold in regulatory filings.
Spatial Separation and Peak Location Metrics
Physical distance between transmitters reduces local field superposition and lowers peak absorption. Measuring spatial separation requires identifying the three-dimensional Cartesian coordinates of maximum SAR for each active frequency band, which lab software extracts from fine-grid area scans over tissue phantoms.
When two radiating hotspots sit within a few millimeters of each other, near-field overlap creates a merged absorption peak larger than either component field. When separation distance exceeds 30 mm to 50 mm in standard smartphone chassis, constructive interference between localized fields drops significantly.
Calculating simultaneous exposure requires including estimated absorption values for secondary low-power radios that qualified for standalone testing exemptions.
- Uncoordinated Burst Overlap occurs when cellular transmit frames align with high-power Wi-Fi beacon bursts, pushing peak instantaneous exposure above steady-state predictions.
- Uncalculated Harmonic Ingress creates unintended energy coupling between secondary antennas, altering near-field absorption patterns inside handheld product enclosures.
- Uncalibrated Antenna Isolation causes unexpected ground plane currents that broaden localized absorption hotspots during dual-band operation.
- Unvalidated Dynamic Time Averaging results in firmware power backoff timing lags during high-throughput packet bursts, exceeding dynamic SAR thresholds.
| Frequency Allocation | Distance Boundary | Standalone Exemption Limit | Estimated SAR Formula Factor | 1-g Summation Ceiling |
|---|---|---|---|---|
| 824 MHz to 894 MHz | 5 mm | 16 mW (12 dBm) | 7.5 Scaling Term | 1.6 W/kg Combined |
| 1850 MHz to 1990 MHz | 5 mm | 11 mW (10.4 dBm) | 7.5 Scaling Term | 1.6 W/kg Combined |
| 2400 MHz to 2483.5 MHz | 5 mm | 10 mW (10 dBm) | 7.5 Scaling Term | 1.6 W/kg Combined |
| 5150 MHz to 5850 MHz | 5 mm | 6 mW (7.8 dBm) | 7.5 Scaling Term | 1.6 W/kg Combined |
Failing to account for simultaneous transmit ratios during layout design forces hardware re-spins or permanent power backoffs that degrade product link budgets.


Coupling
Antenna Separation Geometry and near Field Interactions
Placing radiators within half a wavelength of each other causes mutual impedance shifts and reactive energy sharing. Near-field interactions modify current distribution along metallic ground planes, altering radiation efficiency and pattern shape. This coupling effectively transforms isolated antennas into a combined system with unpredictable SAR characteristics.
In compact form factors like smartwatches or medical monitors, tight layout constraints force Wi-Fi and Bluetooth antennas close together. S-parameter measurements show this coupling through high transmission coefficients between antenna ports.
When antenna port isolation falls below 10 dB, energy injected into antenna A couples directly into the structure of antenna B. This coupled energy radiates from the secondary structure, creating an exposure hotspot away from the primary feed point. Near-field coupling expands spatial SAR spread across human tissue surface layers.
Enclosure Plastics and Ground Plane Detuning Effects
Dielectric loading from polycarbonate or ABS housings pulls resonant frequencies downward and distorts radiation patterns. Human skin resting against plastic outer walls increases effective permittivity near the antenna. PCB ground planes also act as secondary radiators, conducting high-frequency currents across the entire chassis.
When ground plane length matches half an operating wavelength, chassis currents can create peak absorption at enclosure edges far from the physical antenna location. Implementing localized current chokes or slotted ground plane isolators reduces chassis-level radiation during dual-transmitter operation.
- Determine the spatial coordinates of maximum local SAR for each active transmitter from individual area scans.
- Calculate the geometric distance between peak absorption locations using a three-dimensional Cartesian formula.
- Compute the ratio of combined SAR values to spatial distance to obtain peak location separation parameters.
- Compare the resulting ratio against regulatory action limits to determine whether volumetric SAR scanning is required.
Industry consensus is still developing around whether phase-coherent beamforming arrays in handheld devices can be modeled accurately using linear SAR summation without full-wave electromagnetic simulation.

Backoff
Dynamic Power Reduction and Time Averaged SAR Algorithms
Modern cellular and Wi-Fi transceivers use real-time exposure monitoring to adjust maximum conducted output power dynamically. Smart transmit algorithms track energy delivered to surrounding tissue over sliding time windows. When simultaneous transmission modes activate, control logic throttles peak power on individual channels to maintain time-averaged absorption below safety limits.
Time-Averaged SAR technology replaces rigid static power caps with dynamic energy management. A cellular module can transmit at maximum peak power during poor link conditions for brief intervals, provided power is scaled down during subsequent frames. When a user initiates a large Wi-Fi download while on an active cellular call, dynamic backoff algorithms divide the exposure budget between the two radios in real time.
Implementing dynamic power backoff requires real-time coordination between separate radio chipsets. A cellular modem driver must communicate frame timing and output levels to an independent Wi-Fi system-on-chip via dedicated GPIO lines or high-speed bus interfaces. Latency in inter-chip communication can cause transient power spikes that breach calculated SAR exclusion margins.

Source Based Duty Cycle Limitations in Dual Transceivers
Transmitting in discrete time slots reduces average RF energy delivery over standard six-minute or thirty-minute regulatory windows. Radios using time-division duplexing, such as Bluetooth or Wi-Fi, operate with inherent source-based duty cycles. For example, a Bluetooth radio transmitting audio packets at a 33 percent duty cycle delivers one-third the average RF energy of a continuous-wave transmitter operating at the same peak power.
Dynamic power backoff architecture must enforce RF exposure compliance through hardware-locked lookup tables rather than unverified user-space software routines.
Sourcing teams must verify whether stated module output power represents peak burst power or source-based time-averaged power. A 100 mW peak Wi-Fi module operating with a 50 percent maximum frame duty cycle delivers 50 mW average power. Regulatory SAR evaluations strictly rely on source-based time-averaged power figures.
Silicon vendors often claim that dynamic backoff software handles simultaneous compliance automatically, but regulatory filings show that system integrators remain responsible for tuning firmware lookup tables to match physical antenna gain.


Jurisdiction

Divergent Exposure Limits across Global Markets
North American rules enforce a 1.6 W/kg limit averaged over a 1-gram tissue mass, whereas European Union harmonized standards under the Radio Equipment Directive mandate a 2.0 W/kg ceiling over a 10-gram tissue volume.
Because energy is averaged over a larger tissue mass in 10-gram calculations, European test results yield lower numerical SAR values for identical hardware. A device operating near the 1.6 W/kg limit in the United States often registers around 1.0 W/kg under European 10-gram testing. Passing European compliance does not ensure North American access without re-evaluating 1-gram exclusion thresholds.
Japanese MIC regulations align closely with European 10-gram limits, whereas South Korean MSIT rules enforce 1-gram limits similar to FCC standards. Global product launches require managing two distinct evaluation paths for multi-radio compliance. Sourcing standardized radio hardware requires establishing regulatory matrices that cover the strictest regional requirements.
Summation Requirements in FCC, ISED, and RED Approval Files
Filing technical documentation for cross-border equipment requires distinct compliance calculations for each target market. The FCC mandates specific KDB publication workflows listing all simultaneous transmission combinations. Every operational configuration ~ including head, body-worn, and extremity exposure ~ requires its own summation breakdown.
ISED Canada requires an RF Exposure Technical Brief with explicit simultaneous evaluation calculations under RSS-102. European filings under EN 50566 require a Total Exposure Ratio calculation, where the sum of individual exposure ratios across all active frequencies must remain less than or equal to 1.0.
Compliance across international boundaries requires maintaining dual compliance dossiers that account for both one-gram and ten-gram SAR calculation methodologies.
| Regulatory Body | Primary Standard | Averaging Mass | Local SAR Ceiling | Simultaneous Exclusion Formula |
|---|---|---|---|---|
| US FCC | KDB 447498 D04 | 1 gram | 1.6 W/kg | SAR Sum < 1.6 or SPLSR < 0.04 |
| Canada ISED | RSS-102 Issue 6 | 1 gram | 1.6 W/kg | Exposure Ratio Sum < 1.0 |
| EU RED / CE | EN 50566 / IEC 62209 | 10 grams | 2.0 W/kg | Total Exposure Ratio < 1.0 |
| Japan MIC | Radio Law Art. 14-2 | 10 grams | 2.0 W/kg | Combined Exposure Index < 1.0 |
- Transmitter Operating Matrix maps every legal operational combination of concurrent radio modes across supported system power states.
- Standalone SAR Exemption Dossier details exact tune-up tolerances, operating frequencies, and calculated exclusion distances for low-power radios.
- Simultaneous Exposure Summation Sheet presents tabular additive SAR calculations for all co-located antennas across target operational positions.
- Dynamic Power Timing Logs provides oscilloscope and signal analyzer traces verifying dynamic backoff execution timing during high-power multi-radio switching.
Section 4.3.2 of FCC KDB 447498 D01 defines the spatial distance calculation method, shifting compliance verification from physical measurement to analytical evaluation when peak location separation ratios fall below regulatory limits.
Phantom

Liquid Tissue Simulating Liquids and Probe Calibration Ranges
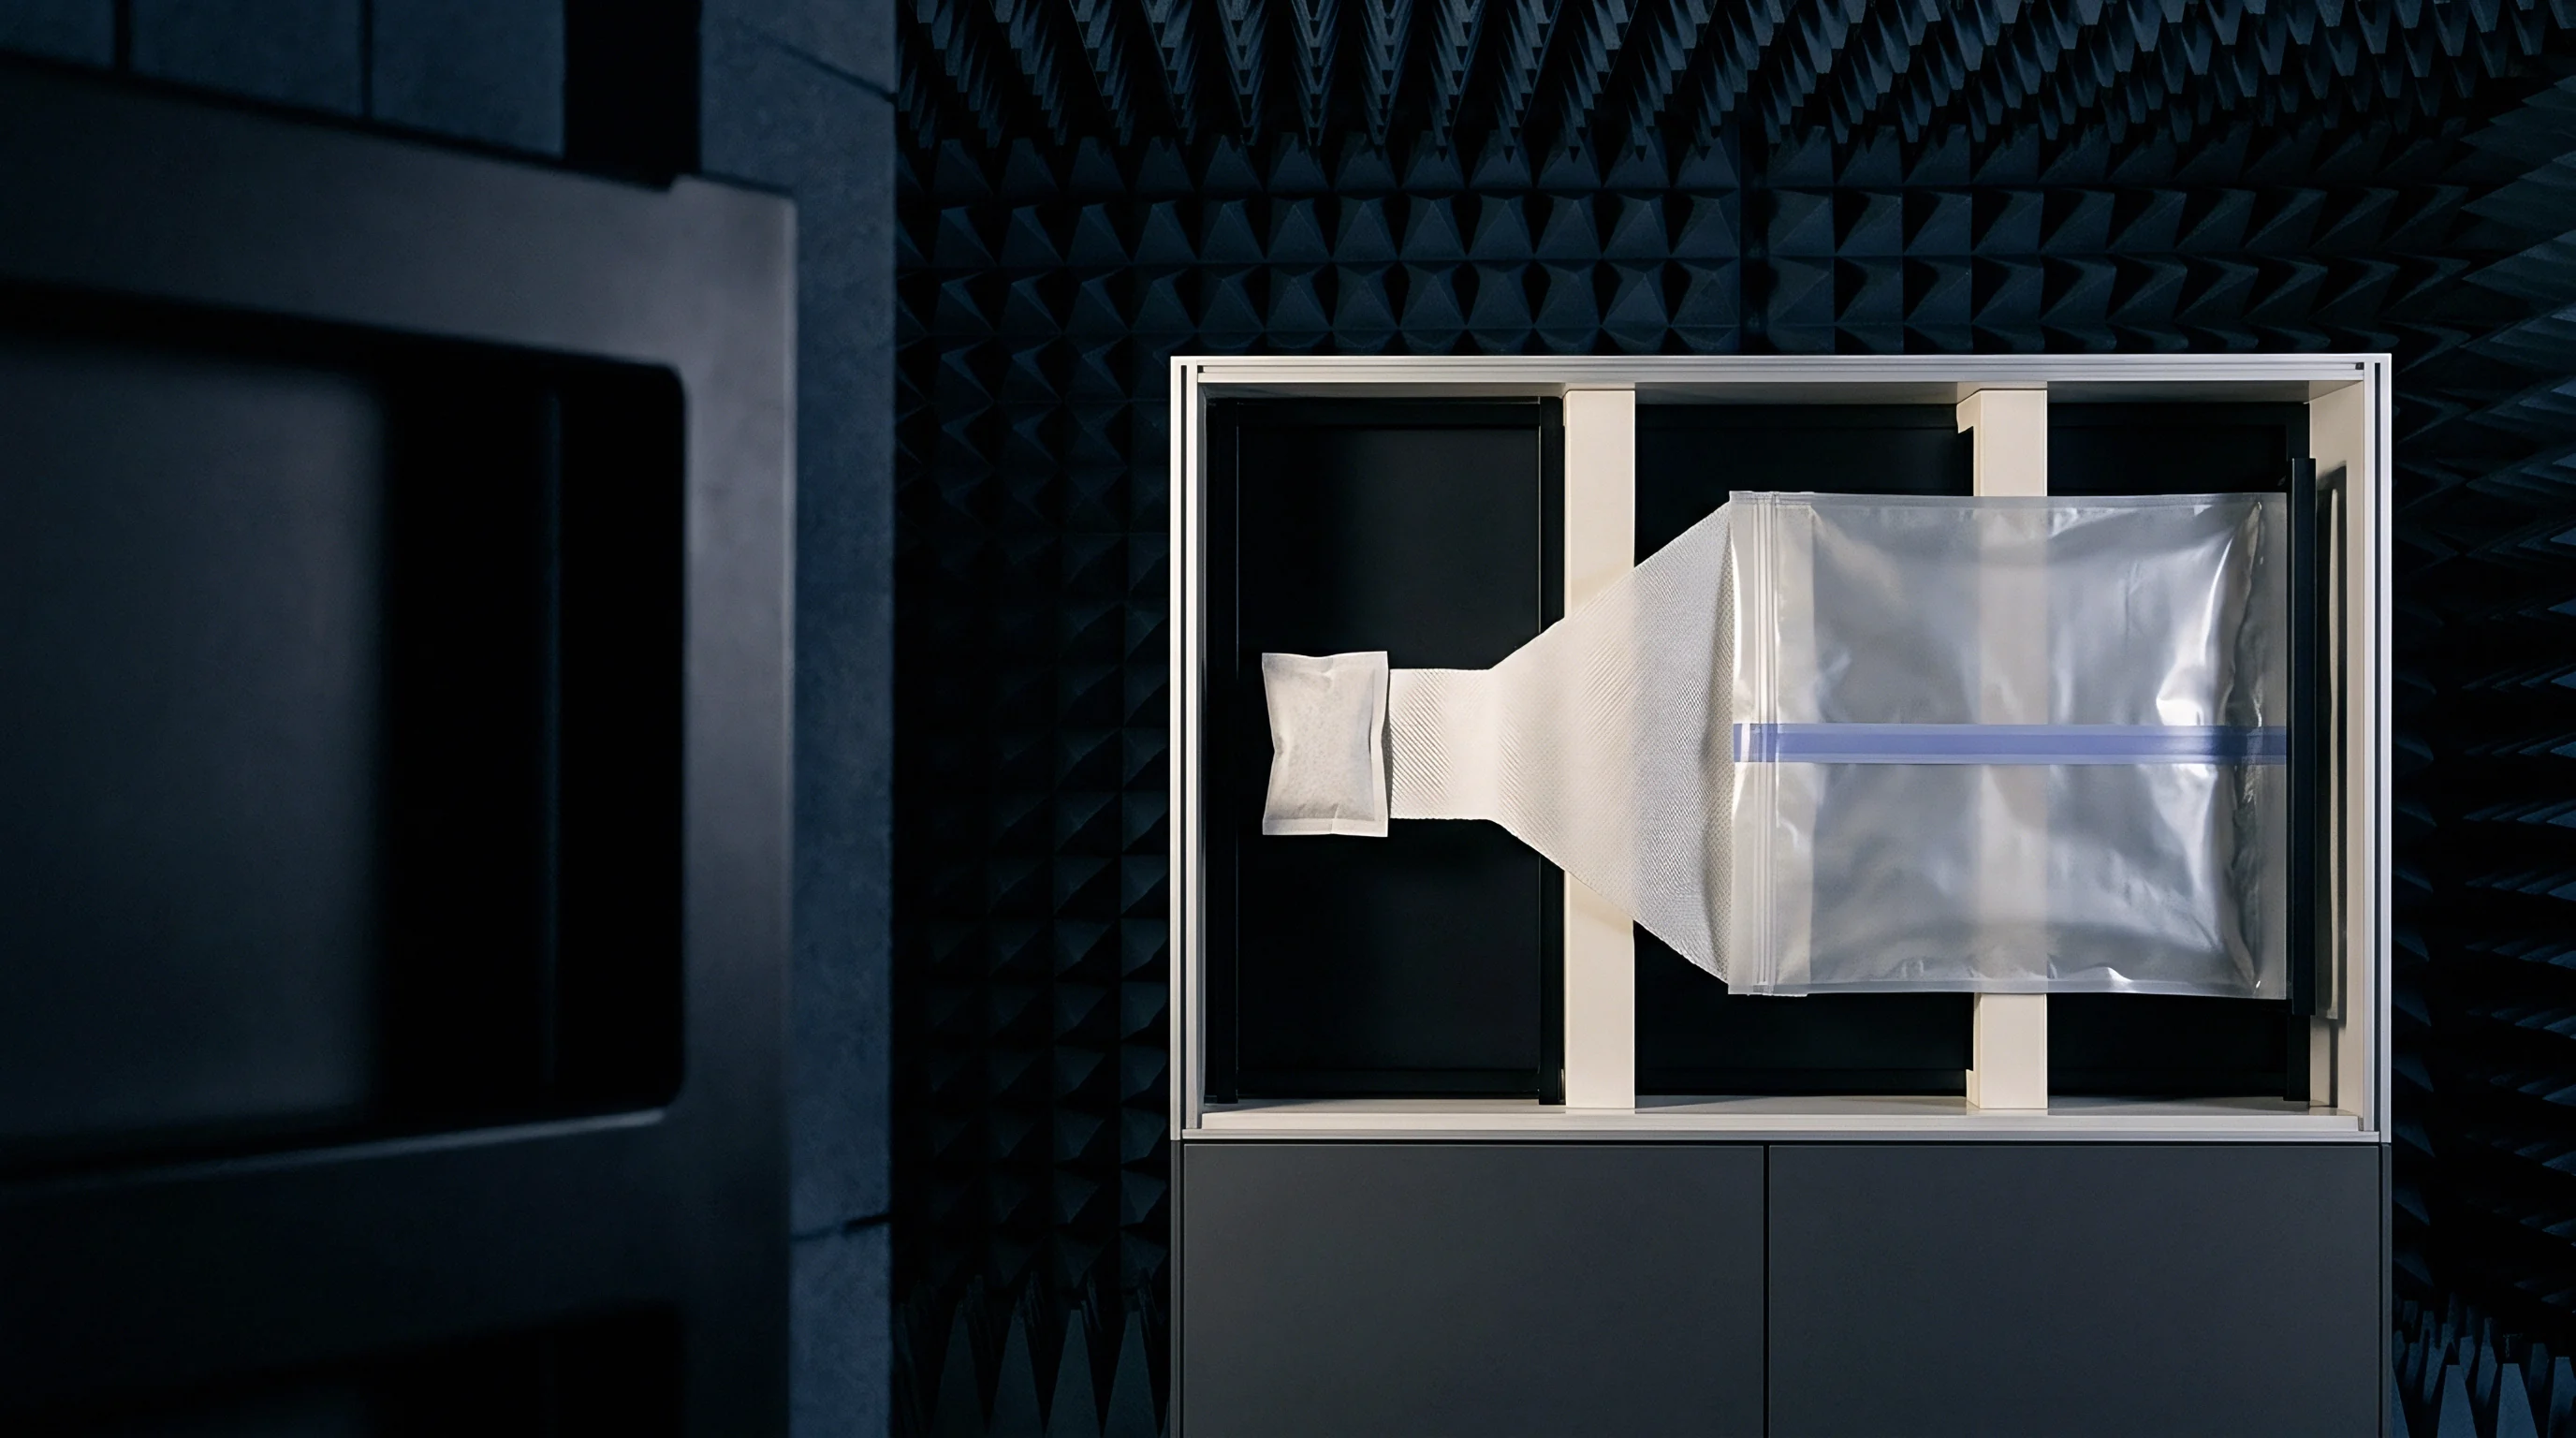
Accurate physical testing relies on liquid mixtures formulated to match dielectric properties across target band allocations. Head and body tissue-simulating liquids use precise formulations of water, salt, sugar, cellulose, and diethylene glycol butyl ether. Measuring complex relative permittivity and conductivity verifies that the liquid absorbs electromagnetic fields like human tissue.
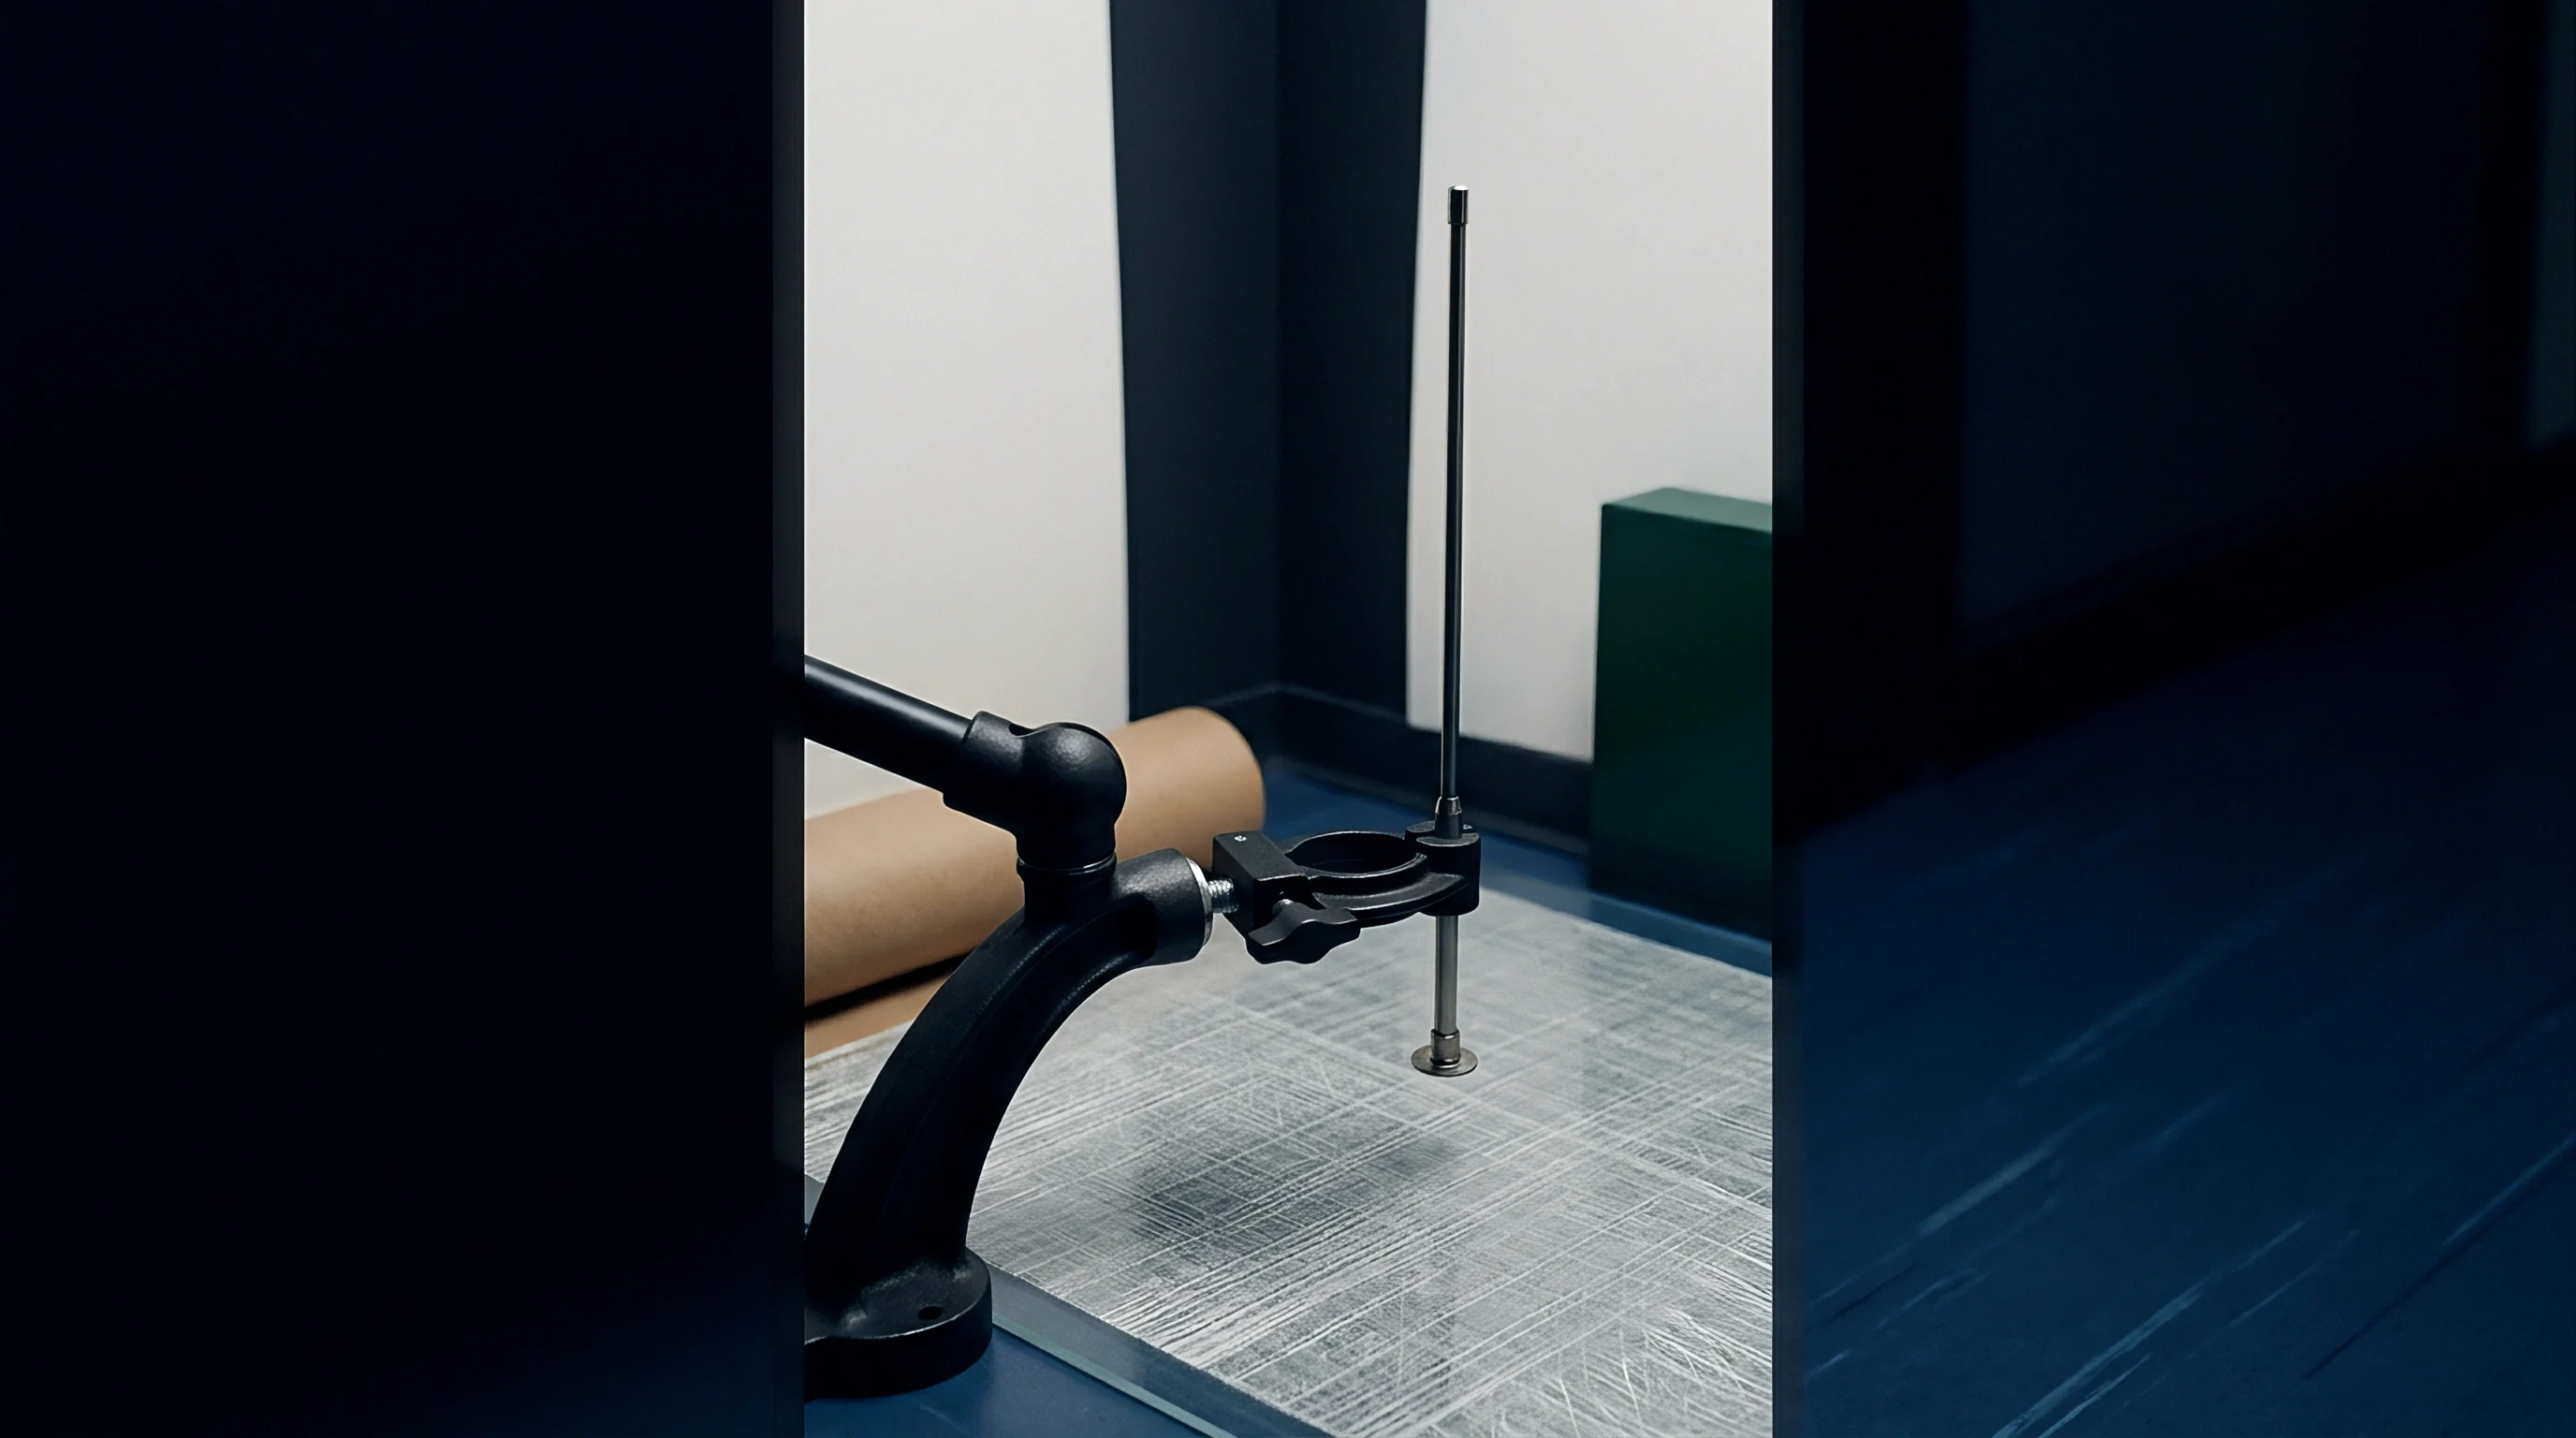
Measurement probes use miniature isotropic E-field dipoles enclosed in protective ceramic shells. Test laboratories calibrate probes individually across target frequency channels using waveguide calibration systems.
Using a probe outside its calibrated frequency window introduces severe measurement errors. Calibration factors change rapidly near dielectric boundaries, requiring optical surface detection systems to position probes within two millimeters of the phantom shell’s inner surface.
Multi Transmitter SAR Scan Mechanics and Hotspot Overlap
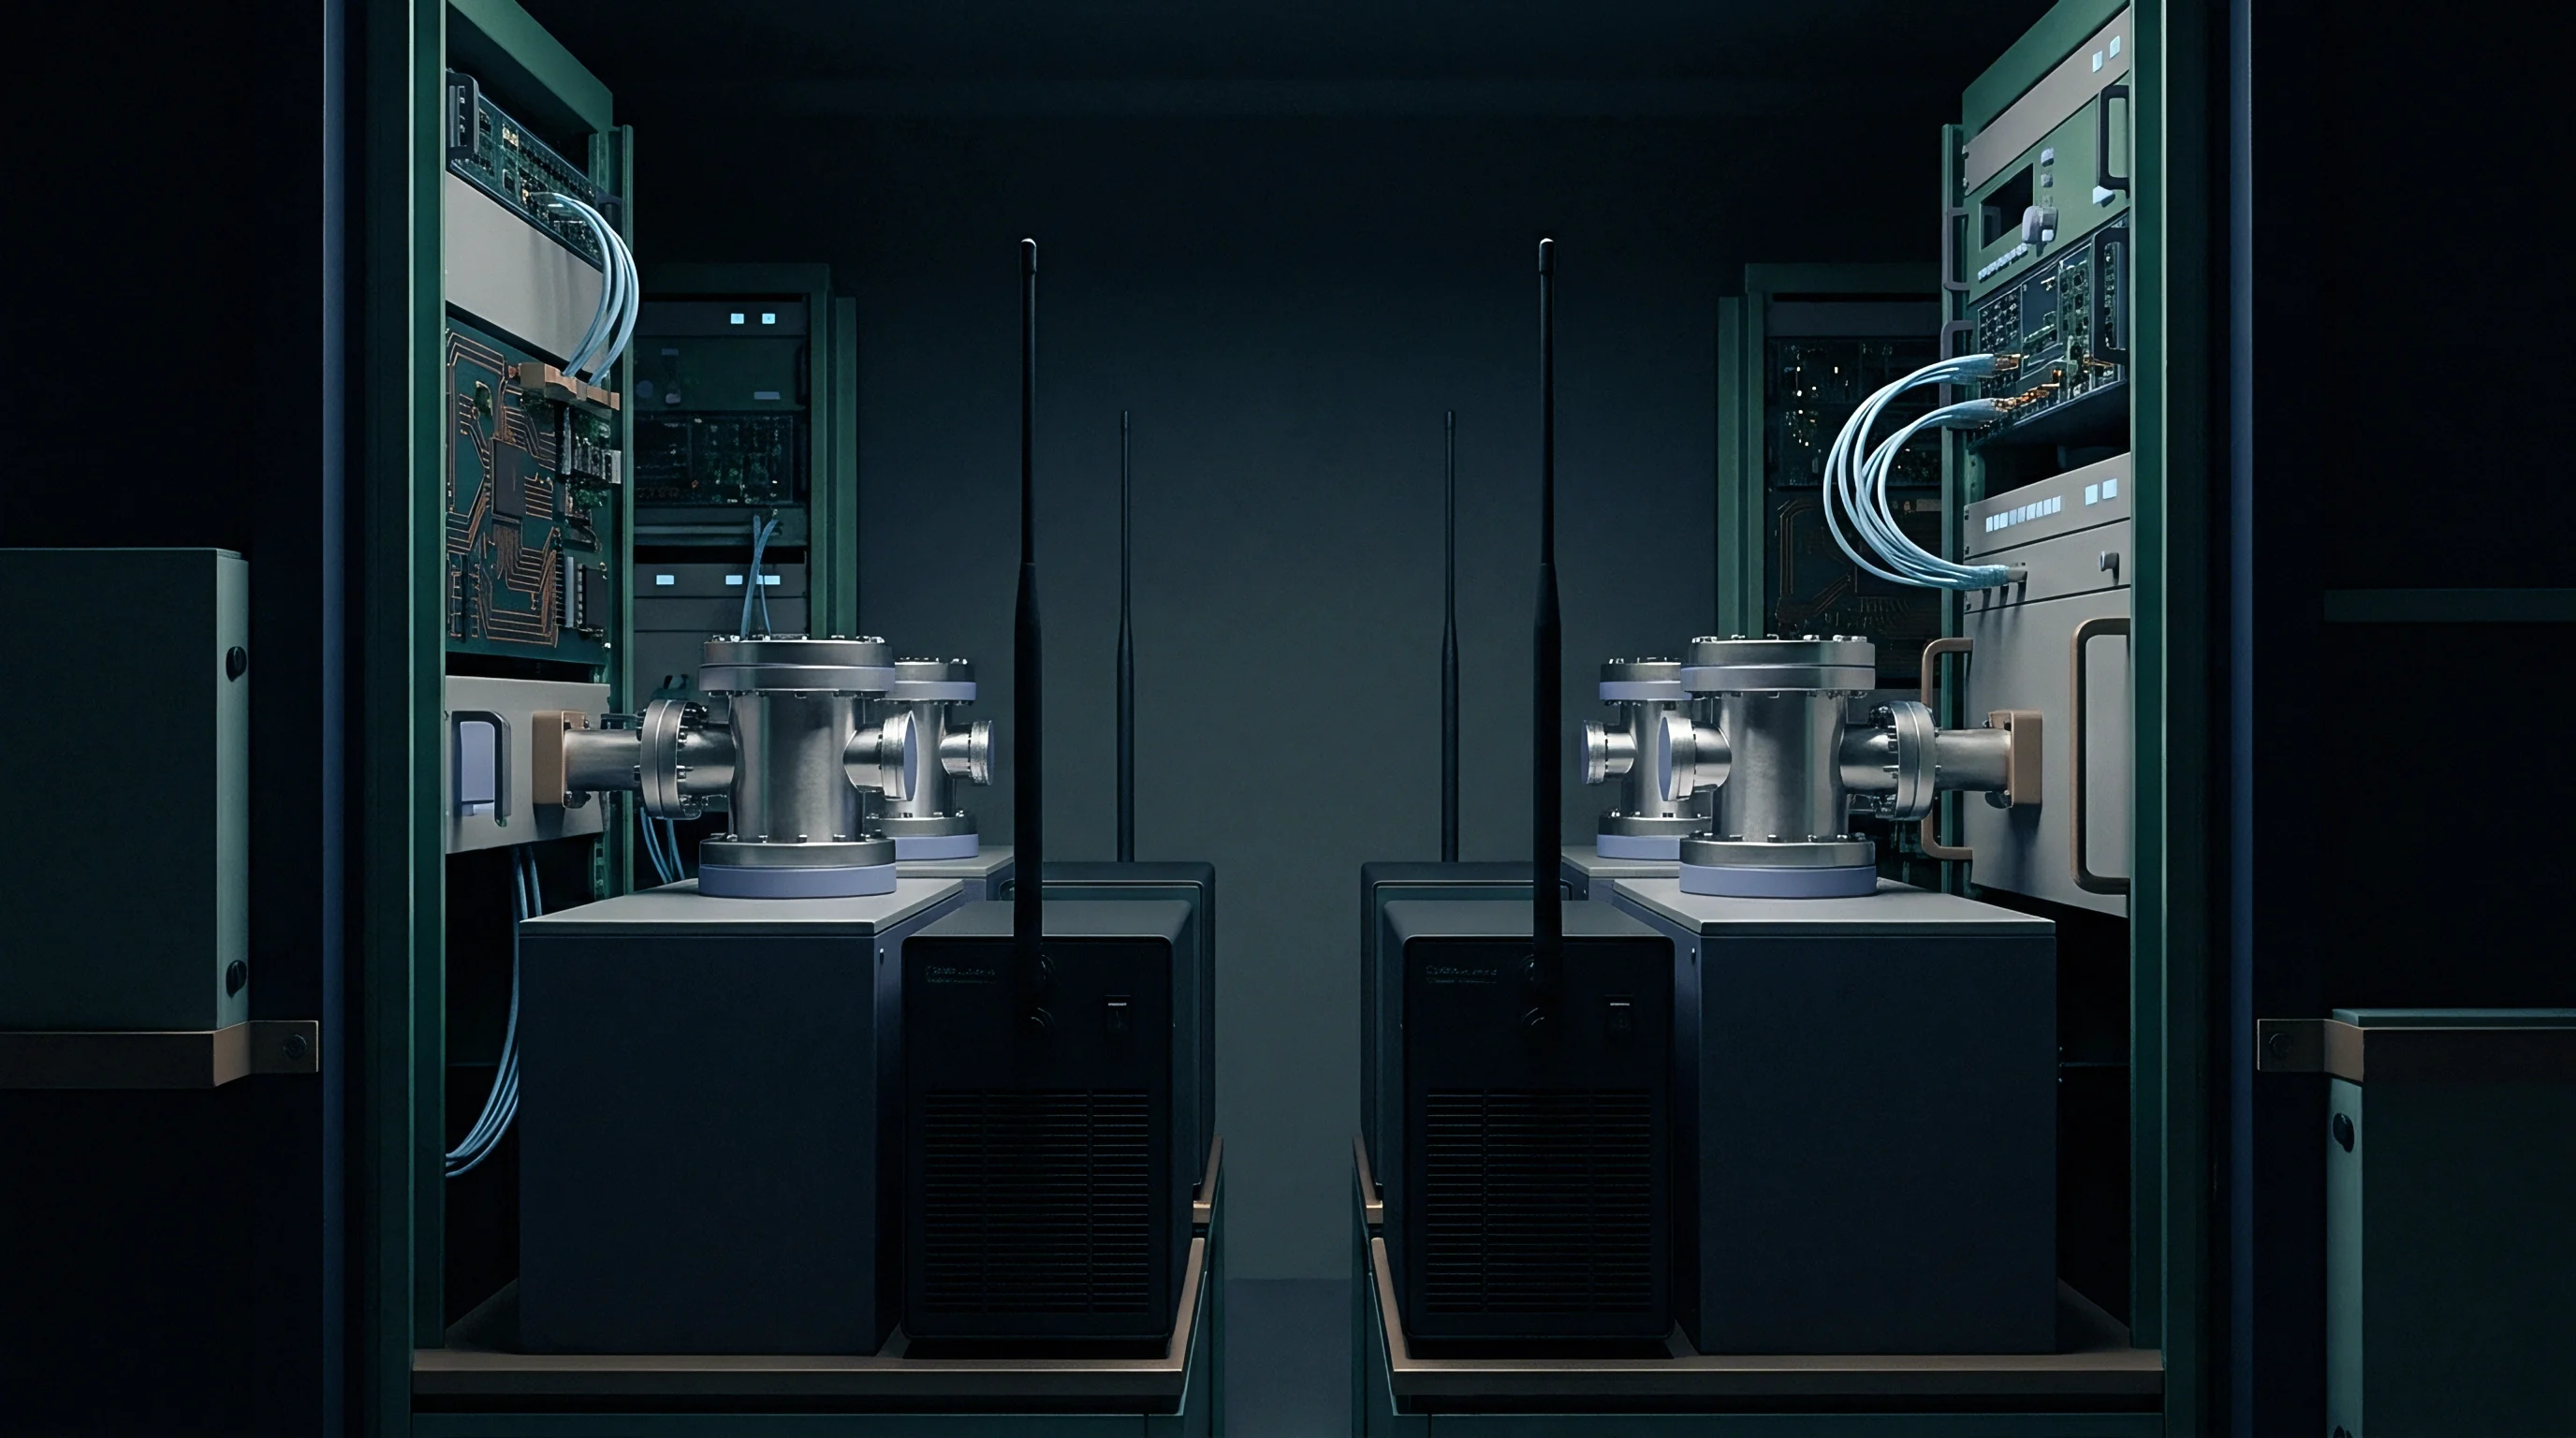
Automated robotic arms guide isotropic electric field detectors through a fine grid above active components. Initial coarse area scans identify exposure hotspots across the device surface, followed by fine-grid volumetric zoom scans to measure three-dimensional field distributions around spatial peaks.
For simultaneous SAR testing, labs measure each active transmitter separately while maintaining identical device positioning against the flat phantom. Post-processing software then overlays individual three-dimensional SAR distributions using spatial alignment algorithms, summing localized field values point-by-point across the volumetric grid to generate composite exposure maps.
| Transmitter Component | Frequency | Conduct Power | Separation Distance | Measured / Estimated 1-g SAR | Combined Status |
|---|---|---|---|---|---|
| Cellular LTE Band 4 | 1710 MHz | 23.0 dBm (200 mW) | 10 mm | 0.95 W/kg (Measured) | Primary Contributor |
| Wi-Fi 2.4 GHz | 2412 MHz | 15.0 dBm (31.6 mW) | 10 mm | 0.43 W/kg (Measured) | Secondary Contributor |
| Bluetooth LE | 2402 MHz | 4.0 dBm (2.5 mW) | 10 mm | 0.05 W/kg (Estimated) | Excluded Standalone |
| Cumulative System Total | Co-located | Combined Mode | 10 mm Chassis | 1.43 W/kg Summed | Compliant (Sum < 1.6 W/kg) |
Laboratory engineers complete the filing package by archiving raw probe drift logs and spatial area scan heat maps alongside the signed test report.